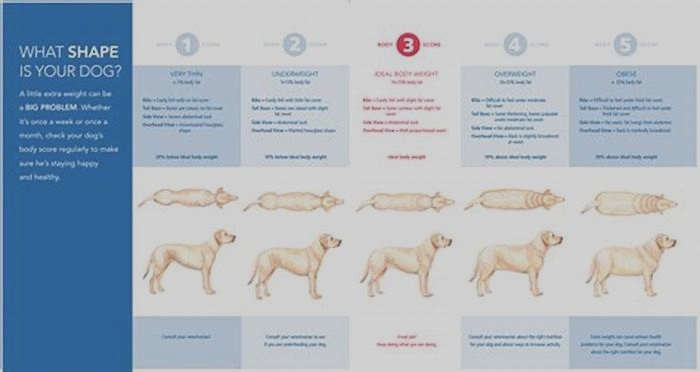
How to Measure Your Dachshunds Body Condition Score
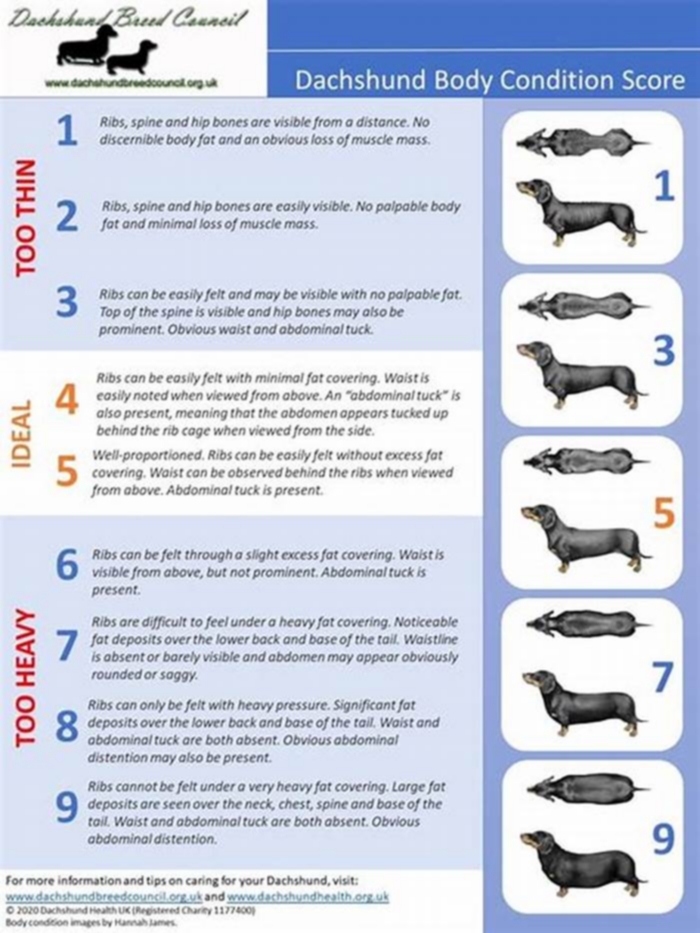
Body Condition
For a healthy, happy Dachshund, you need to keep him at the right weight throughout his life. Being overweight, or indeed underweight, can lead to serious healthrisks. It is good to get into the habit of checking your Dachshund's weight on a regular basis. ThePet Size_O-Meteris the perfect tool to help you do this.
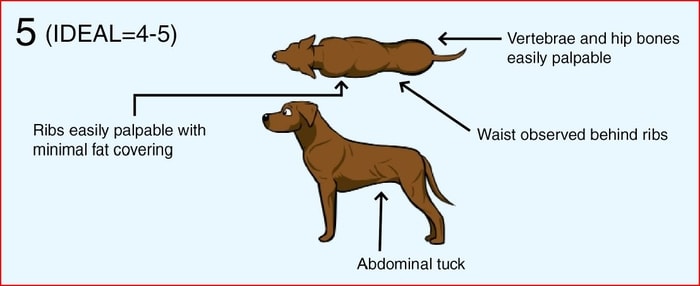
Your Dachshund is at an ideal weight if you can easily feel his ribs, but they are not visible. He should have an obvious waist behind the ribs, when viewed fromabove. There should be little abdominal fat and a slight tuck-up should be evident when he is viewed from the side.
Your Dachshund is not getting enough to eat if you can easily see his ribs, spine and pelvic bones. You will be unable to feel any fat on his bones, and will possiblynotice some loss of muscle mass. He will have an obvious abdominal tuck-up, when viewed from the side. You should increase the size of his portions and maybe consider finding a food with a highercalorie level.
Your Dachshund is overweight if you cannot feel his ribs and can see fat over his back and the base of his tail. He will also have rolls of fat on his neck and overhis shoulders. He will have no discernible waist behind the ribs, when viewed from above, and you will be able to see excessive abdominal fat or a distended underline, in profile. The risk of obesityincreases with age and is more common in neutered animals, and there are associated risks of diabetes and osteoarthritis. The most obvious solution is to reduce the quantities your Dachshund eats(including titbits!), or move him onto a lower calorie food.
For those Dachshund owners interested in showing their dog, the Breed Standard defines theMiniatureand Standardvarietieson the basis of theirweight:
Standards:9-12 kg (20-26 lbs),Miniatures:Ideal weight 4.5 kg (10 lbs), desired maximum weight 5 kg (11 lbs); The Breed Standard alsosays:Exhibits which appear thin and undernourished should be severely penalised.
Remember, the BreedStandarddescribes theidealsizes of Standard andMiniatureDachshunds; these ARE NOT "target weights" forindividual dogs. Every Dachshund will be different and will need to be fed to keep his ideal weight for his frame.
More advice on "what should my Dachshund weigh?"
Dog Body Condition Score: Most Important Points You Must Know
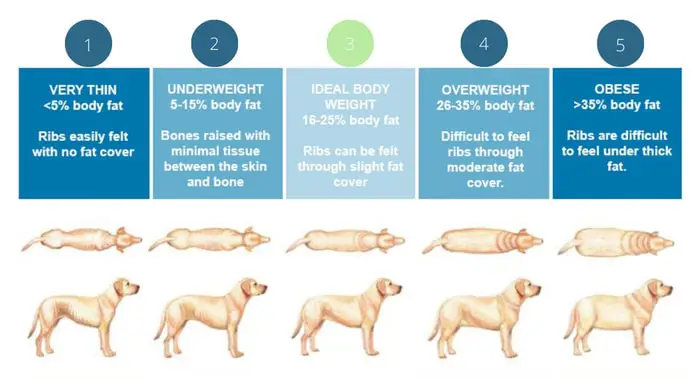
Visual assessment of dogs and cats can be standardized using a body condition scoring (BCS) system for practicing veterinarians and dog owners. Several systems are available to your practitioners and your dogs, all of which involve qualitative ranking of dog body condition score based upon visual assessment and palpation. The two most common systems of dog BCS are using either five points (a score of 3 corresponds to the ideal body condition) or nine points (a score of 5 corresponds to the ideal body condition).
What are Dog Body Condition Scores?
Clinical experiments have shown that body scoring systems provide a highly reliable method for diagnosing obesity and predicting percent body fat. Comparing body condition data collected using Dual-energy X-ray absorptiometry (DEXA) with body condition assessments using a nine-point represents significant and affirmative correlations between body condition scores and percent body fat in both your dogs and cats. The five-point scoring system of dog BCS typically includes half-point assessments; the two scales are, in practice, very similar.
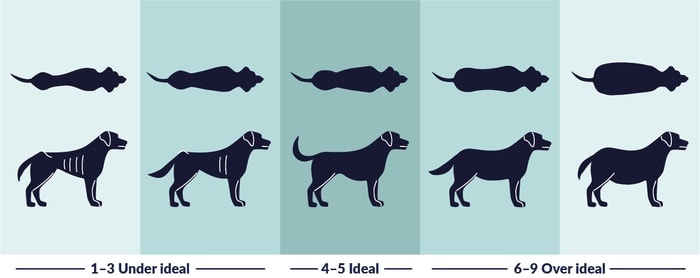
Dog BCS: 1 Thin
- The ribs, lumbar vertebrae, and bones of the pelvic region are visible at a distance and felt without pressure.
- No palpable fat over tail base, spine, or ribs.
- Diminished muscle mass.
- Extreme concave abdominal tuck when viewed from the side.
- Several hourglass shapes when viewed from above.
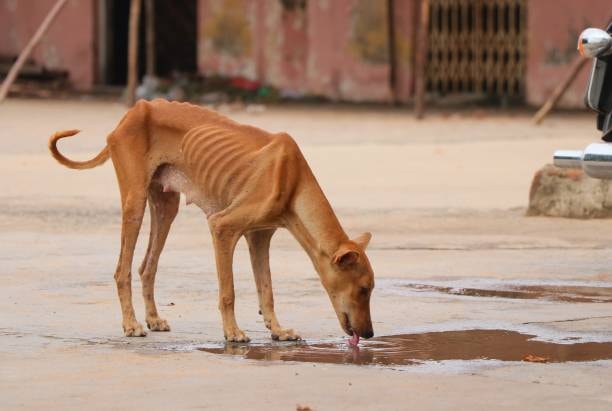
Dog Body Condition Score: 2 Underweight
- Ribs palpable with little pressure may be visible.
- Minimal palpable fat over ribs, spine, tail base.
- Increased concave abdominal tuck when viewed from the side.
- Marked hourglass shape to the waist when viewed from above.

Dog BCS: 3 Ideal
- Ribs and spine palpable with a slight pressure but not visible, no excess fat covering.
- Ribs can be seen with the motion of the dog.
- Good muscle tone apparent.
- Concave abdominal tuck when viewed from the side.
- Hourglass shape to the waist when viewed from above.
Dog BCS 4: Overweight
- Ribs palpable with increased pressure, not visible, and have excess fat covering.
- Ribs are not seen with the motion of the dog.
- General hefty appearance.
- Abdominal concave tuck is reduced or absent when viewed from the side.
- Loss of hourglass shape to waist with the back slightly broadened when viewed from above.

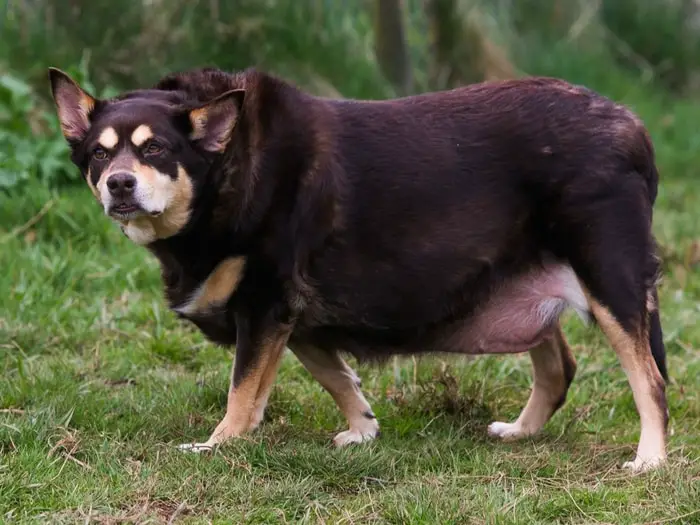
Dog BCS 5: Obese
- Ribs and spine not palpable under a heavy fat covering.
- Fat deposits are visible over the lumbar area, tail base, and spine.
- Loss of hourglass shape to the waist.
- Complete loss of abdominal tuck with the rounded abdomen.
- The back is markedly broadened.
Limitations of Body Condition Scoring System in Dogs
The two limitations of BCS systems are that their subjectivity can lead to wide interobserver variation, and some training in morphological metric assessments may be needed. Recently, a seven-point assessment system has been developed that provides an easy-to-use flowchart and set of diagrams for you. However, this system still requires standardization studies to determine if it effectively identifies overweight and obese pets.
Concluding Remarks on Dog Body Condition Score
In my article, I will give you a clear idea for measuring your dogs body condition score. You must remember that when you measure your dogs Body Condition Score at home should not replace going to see your vet. You ask your vet for the scoring system, and your vet gives you a detailed scoring chart for your dog. Thank you for your time.
BODY CONDITION
On this page

What is body condition scoring?
Body condition scoring is a low cost, hands-on method to determine the condition (amount of fat cover) cattle have. This easy hands-on method is much more accurate than just looking at the animals.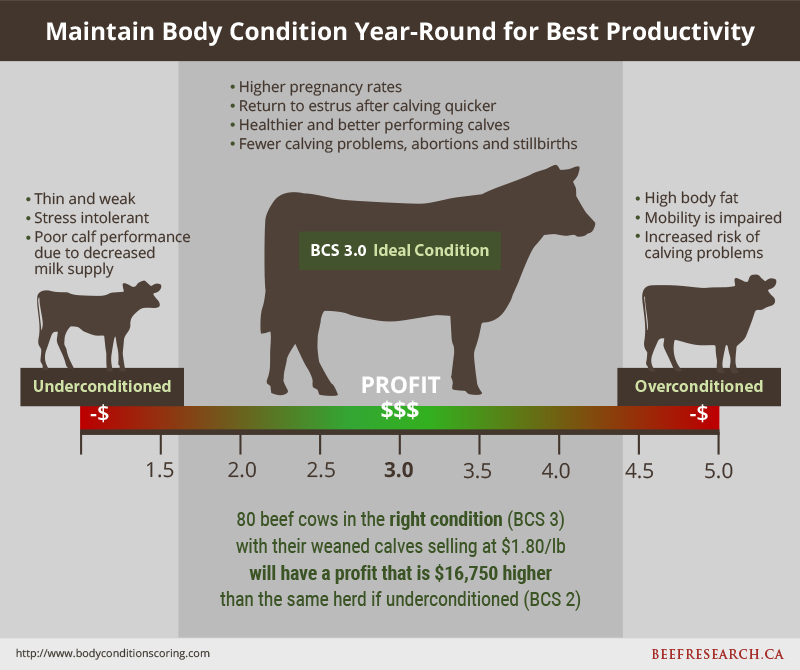
Looks can be deceiving, even to the trained and experienced eye. The shadows that help you see the bodys dips and hollows are harder to see on black cattle. The accuracy of visual evaluation also varies with the season. Prominent rib, hook and pin bones can be masked by long winter hair coats. Thin cows with round bellies full of straw can be mistaken as being in ideal condition when in fact they need improvement.
Research from the University of Guelph reported that even trained visual evaluators had a hard time accurately predicting the body condition score of cows in winter. The correlation between visual scores and ultrasonic backfat measurements was low (r2 = 0.14) in January to March. Cows in later stages of pregnancy may also appear to have more fat cover. A hands-on evaluation of the body condition score will give you a much better sense of your cows fat stores.
In Canada, body condition is scored from 1-5, with 1 being extremely thin and 5 being obese. A score of 3.0 is ideal.
How do I body condition score?
 Feel for fat cover with your hands at:
An animal in ideal condition will have a thin layer of fat in these areas, so it will take some pressure to feel the bones.
An underconditioned animals bones will be quite prominent and sharp. In an obese animal, you wont be able to feel any of the individual bones through the thick layer of fat.
See a demonstration in the video below.
Why is measuring body condition worthwhile?
By having an accurate measure of your cows body condition, youll have a good indicator of how to manage their rations to maximize their productivity, especially reproduction.
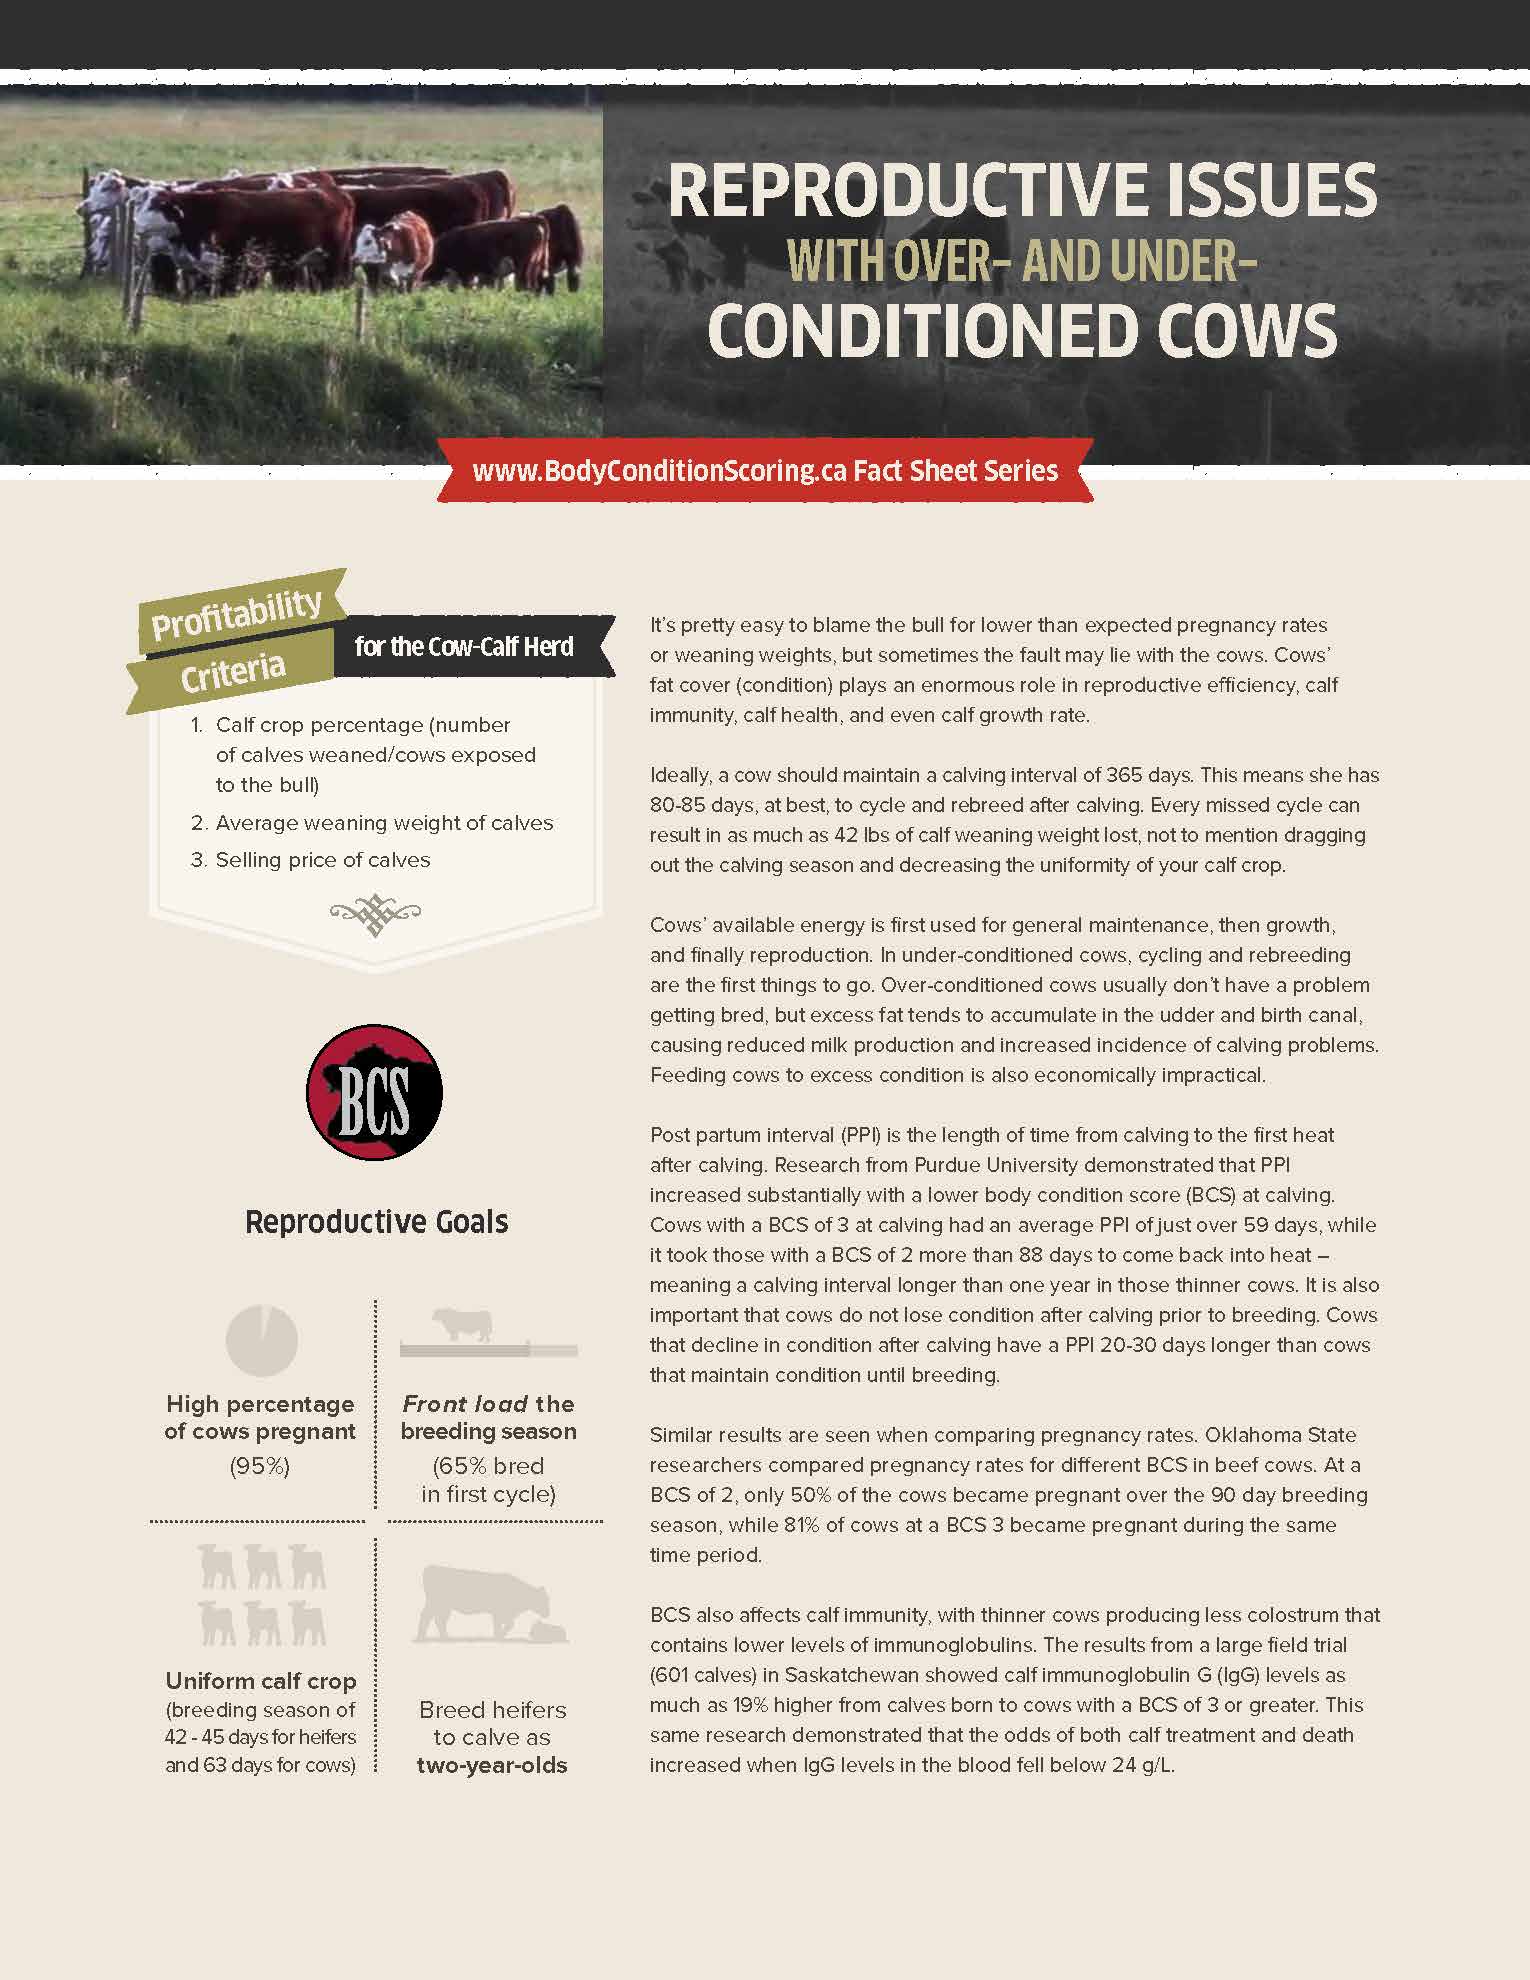
Cows with an ideal body condition score (3.0) rebreed up to 30 days sooner than thin cows, which allows more cows to calve in the first 21-day cycle. This can add up to 42 lbs in calf weaning weight since the calves born earlier in the calving season will be heavier at weaning time. Cows in ideal body condition also have pregnancy rates double those of cows in poor condition, have improved milk production, fewer cases of abortion and stillbirth, healthier calves, and have fewer instances of calving problems.
The salvage value of cull cows in good condition is also higher. Very thin cows are more likely to experience negative outcomes during transport or to be condemned at the plant. Thin cows reflect poorly on the producer and the industry. It is important to note that thin cows are not always strictly related to nutrition. Several diseases such as Johnes disease can be a contributing factor to thin cows.
Slide the bar below to see how body condition affects cows productivity and the value of their weaned calves.
1.5
2.0
2.5
3.0
3.5
4.0
4.5
5.0
BCS:
1 Underconditioned
General Description
Emaciated; starving and weak; the entire body is extremely thin, and all skeletal structures are prominently visible. No muscle tissue is evident and no external fat is present. All the skeletal structures are visible and very sharp to the touch. The hair coat appears to be very dull. Survival during stress is doubtful.
Source: Alberta Agriculture and Rural Development
Calving Interval (days):
data unavailable
% Showing Estrus 30 Days After Calving:
46
% Showing Estrus 60 Days After Calving:
66
Post Partum Interval:
data unavailable
Calf Weaning Weight (lbs):
data unavailable
Calf ADG (lbs):
data unavailable
Abortion (%):
data unavailable
Stillbirth (%)
data unavailable
Calf Death Loss Birth to Summer Pasture Turnout (%):
data unavailable
Risk of severe dystocia (%):
data unavailable
DYSTOCIA
Cows that are in a low body condition (<2.5) are more likely to have low energy during calving and therefore may take longer to calve. As a result, calves will have a lower energy supply both during and after calving.
Milk Production
Thin cows have less energy available for milk production. As a result, calf performance may suffer due to a decreased milk supply.
Data updated in 2018
BCS:
1.5 Underconditioned
General Description
Very thin, somewhat emaciated; The vertebrae along the topline are prominent. The hooks and tail head are visually less prominent. There is no fat around the hip bone and pin bone and tail head.
Source: Alberta Agriculture and Rural Development
Calving Interval (days):
414
% Showing Estrus 30 Days After Calving:
46
% Showing Estrus 60 Days After Calving:
66
Calf Weaning Weight (lbs):
374
Abortion (%):
data unavailable
Stillbirth (%)
data unavailable
Calf Death Loss Birth to Summer Pasture Turnout (%):
data unavailable
Risk of severe dystocia (%):
data unavailable
DYSTOCIA
Cows that are in a low body condition (<2.5) are more likely to have low energy during calving and therefore may take longer to calve. As a result, calves will have a lower energy supply both during and after calving.
Milk Production
Thin cows have less energy available for milk production. As a result, calf performance may suffer due to a decreased milk supply.
Data updated in 2018
BCS:
2 Underconditioned
General Description
The animal is thin. The vertebrae along the topline are prominent. Muscle tissue is evident, but not abundant. Individual vertebrae ca be felt, but are not as sharp. The short ribs can be identified individually when touched, but they feel sharp rather than very sharp. Individual ribs can be identified visually. There is some tissue cover around the hook and tail head.
Source: Alberta Agriculture and Rural Development
Calving Interval (days):
381
% Showing Estrus 30 Days After Calving:
61
% Showing Estrus 60 Days After Calving:
92
Calf Weaning Weight (lbs):
460
Calf Death Loss Birth to Summer Pasture Turnout (%):
4.0
Risk of severe dystocia (%):
8.5
DYSTOCIA
Cows that are in a low body condition (<2.5) are more likely to have low energy during calving and therefore may take longer to calve. As a result, calves will have a lower energy supply both during and after calving.
Milk Production
Thin cows have less energy available for milk production. As a result, calf performance may suffer due to a decreased milk supply.
Data updated in 2018
BCS:
2.5 Underconditioned
General Description
Individual ribs noticeable but overall fat cover is lacking; increased musculature through shoulders and hindquarters; hips and short ribs feel slightly round versus sharp.
Source: Alberta Agriculture and Rural Development
Calving Interval (days):
364
% Showing Estrus 30 Days After Calving:
61
% Showing Estrus 60 Days After Calving:
92
Calf Weaning Weight (lbs):
515
Calf Death Loss Birth to Summer Pasture Turnout (%):
4.0
Risk of severe dystocia (%):
4.0
Milk Production
Data updated in 2018
General Description
Increased fat cover over ribs, and ribcage is only slightly visible. Muscle tissue is nearing the maximum. Generally only the 12 and 13 ribs are individually distinguishable. There are obvious fat deposits behind the front shoulder. Areas on each side of the tail head are fairly well filled but not rounded.
Source: Alberta Agriculture and Rural Development
Calving Interval (days):
364
% Showing Estrus 30 Days After Calving:
91
% Showing Estrus 60 Days After Calving:
100
Calf Weaning Weight (lbs):
515
Calf Death Loss Birth to Summer Pasture Turnout (%):
3.8
Risk of severe dystocia (%):
3.7
Dystocia
No increased risk.
Milk Production
No increased risk.
Data updated in 2018
Data updated in 2018
BCS:
3.5 Overconditioned
Calving Interval (days):
data unavailable
% Showing Estrus 30 Days After Calving:
91
% Showing Estrus 60 Days After Calving:
100
Calf Weaning Weight (lbs):
460
Calf ADG (lbs):
data unavailable
Calf Death Loss Birth to Summer Pasture Turnout (%):
3.8
Risk of severe dystocia (%):
4.5
DYSTOCIA
In overconditioned cows, calves are more likely to have a higher birth weight and excessive fat can accumulate in the pelvis resulting in a smaller birth canal, which together can cause calving difficulties.
Milk Production
Data updated in 2018
General Description
Moderately fat the bone structure is no longer noticeable. The skeletal structure is difficult to identify. Individual short ribs cannot be felt even with firm pressure. Folds of fat are beginning to develop over the ribs and thurl area of the animal. Fat cover around the tail head is evident on both sides as slight rounds that are soft to the touch.
Source: Alberta Agriculture and Rural Development
Calving Interval (days):
data unavailable
% Showing Estrus 30 Days After Calving:
data unavailable
% Showing Estrus 60 Days After Calving:
data unavailable
Post Partum Interval:
data unavailable
Calf Weaning Weight (lbs):
data unavailable
Calf ADG (lbs):
data unavailable
Abortion (%):
data unavailable
Calf Death Loss Birth to Summer Pasture Turnout (%):
data unavailable
Risk of severe dystocia (%):
5.0
DYSTOCIA
In overconditioned cows, calves are more likely to have a higher birth weight and excessive fat can accumulate in the pelvis resulting in a smaller birth canal, which together can cause calving difficulties.
Milk Production
Data updated in 2018
BCS:
4.5 Overconditioned
General Description
Fat; very fleshy, squared appearance due to excess fat over back, tail head, and hindquarters. Individual short ribs cannot be felt even with firm pressure. Mobility may begin to be restricted.
Source: Alberta Agriculture and Rural Development
Pregnancy Rate (%):
data unavailable
Calving Interval (days):
data unavailable
% Showing Estrus 30 Days After Calving:
data unavailable
% Showing Estrus 60 Days After Calving:
data unavailable
Post Partum Interval:
data unavailable
Calf Weaning Weight (lbs):
data unavailable
Calf ADG (lbs):
data unavailable
Abortion (%):
data unavailable
Stillbirth (%)
data unavailable
Calf Death Loss Birth to Summer Pasture Turnout (%):
data unavailable
Risk of severe dystocia (%):
5.0
DYSTOCIA
In excessively overconditioned cows, calves are more likely to have a higher birth weight and excessive fat can accumulate in the pelvis resulting in a smaller birth canal, which together can cause calving difficulties.
Milk Production
When cows are overconditioned, fat begins to deposit in the udder and reduce the amount of space available for milk production. As a result, calf performance may suffer due to decreased milk supply.
Data updated in 2018
General Description
Very fat or obese The animal has a blocky appearance. The bone structure is not noticeable. The back bone has a flat appearance and cannot be felt even with pressure. Folds of fat are apparent over the ribs, thurl and thighs. The hip bones and tail head to pin area on both sides are completely buried in fat. The animals mobility is impaired by the large amounts of fat.
Source: Alberta Agriculture and Rural Development
Pregnancy Rate (%):
data unavailable
Calving Interval (days):
data unavailable
% Showing Estrus 30 Days After Calving:
data unavailable
% Showing Estrus 60 Days After Calving:
data unavailable
Post Partum Interval:
data unavailable
Calf Weaning Weight (lbs):
data unavailable
Calf ADG (lbs):
data unavailable
Abortion (%):
data unavailable
Stillbirth (%)
data unavailable
Calf Death Loss Birth to Summer Pasture Turnout (%):
data unavailable
Risk of severe dystocia (%):
data unavailable
DYSTOCIA
In excessively overconditioned cows, calves are more likely to have a higher birth weight and excessive fat can accumulate in the pelvis resulting in a smaller birth canal, which together can cause calving difficulties.
Milk Production
When cows are overconditioned, fat begins to deposit in the udder and reduce the amount of space available for milk production. As a result, calf performance may suffer due to decreased milk supply.
Data updated in 2018
The value of your weaned calves based on this BCS
To see the full version of the Body Condition Scoring tool, Please visit www.beefresearch.ca from your tablet or personal computer.
Feed Cost Calculator
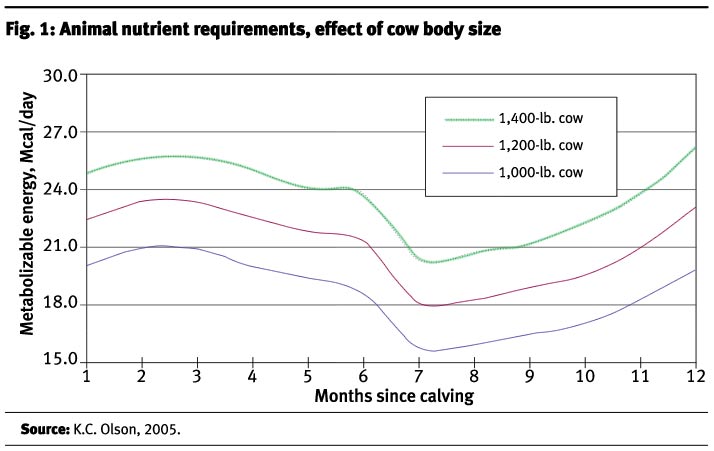
Scenario: Increase BCS from 2 to 3 in a 1400 lb cow in mid gestation in thermoneutral weather.
Instructions: Use the drop down menu to choose a feeding period. Use the drop down in the Proportions of Diet column to approximate the proportion of each feedstuff in the diet (the combined values of the four dropdowns must add to 100%). Manually enter the cost/lb of each desired feedstuff into the Feedstuff column. All the rest of the cells will autocalculate.
Disclaimer: This calculator is for demonstration purposes only and may not apply to your cowherd and feeding situation. To get a precise idea of what your cows need, please get your feed tested and then consult ration balancing software (e.g. CowBytes) or a nutritionist.
In this scenario, the extra feed cost to improve condition from BCS 2 to 3 does not offset the extra value of the weaned calf crop but consider:
1. Alternative ways to improve condition at other times of the year:
- It is easier and more economical to add condition in early-mid gestation (summer/early fall) than in mid-late gestation (late fall/winter). Next year, if working to improve condition, consider supplying high quality feed or pasture at an earlier and more economical time of the season.
- Weaning calves from thin cows early will lower those cows energy needs.
2. Poor condition is a slippery slope:
- If poor condition is not improved, reproductive momentum will be lost: first the calving season will lengthen, subsequently weaning weights will decrease, and open rates will increase.
- Selling an open thin cull cow will not offset calf revenue from a cow that remains in the herd and calves on time for many years.
- Thin bred cows will continue to lose condition, which could develop into a significant welfare concern if not remedied.
NOTE: the following data is based on the Number of Cows and Sale Price of Weaned Calves values from the calculator above the Feed Cost Calculator; ie. changing those values will also affect this data.
Extra Value of Weaned Calf Crop Earned per Cow per Day
Extra Value of Weaned Calf Crop Earned per Cow per Feeding Period
Supplemental Feedstuff extra con
60 days
90 days
Supplemental Feedstuff total
60 days
90 days
**In some instances a cow will not be able to physically consume enough of a particular feedstuff to get the nutrients required. For a 1400 lb cow on barley, maximum intake is about 33 lbs/day, for average quality alfalfa grass hay and cereal silage, 29 lbs/day, and good quality cereal straw 27 lbs/day. If any of your feedstuffs in the Total lbs of feedstuff required/day column are above those numbers, you need to readjust the proportions of each feedstuff in the diet.
**During periods of cold temperatures, a general rule of thumb is to increase the energy component of the ration by feeding additional grain or pellets at a rate of one lb. per head per day for every -5 C that the temperature is below -20 C at mid-day. For example, if the afternoon air temperature was -35 C, feed an additional three lb. of grain or pellets per cow.
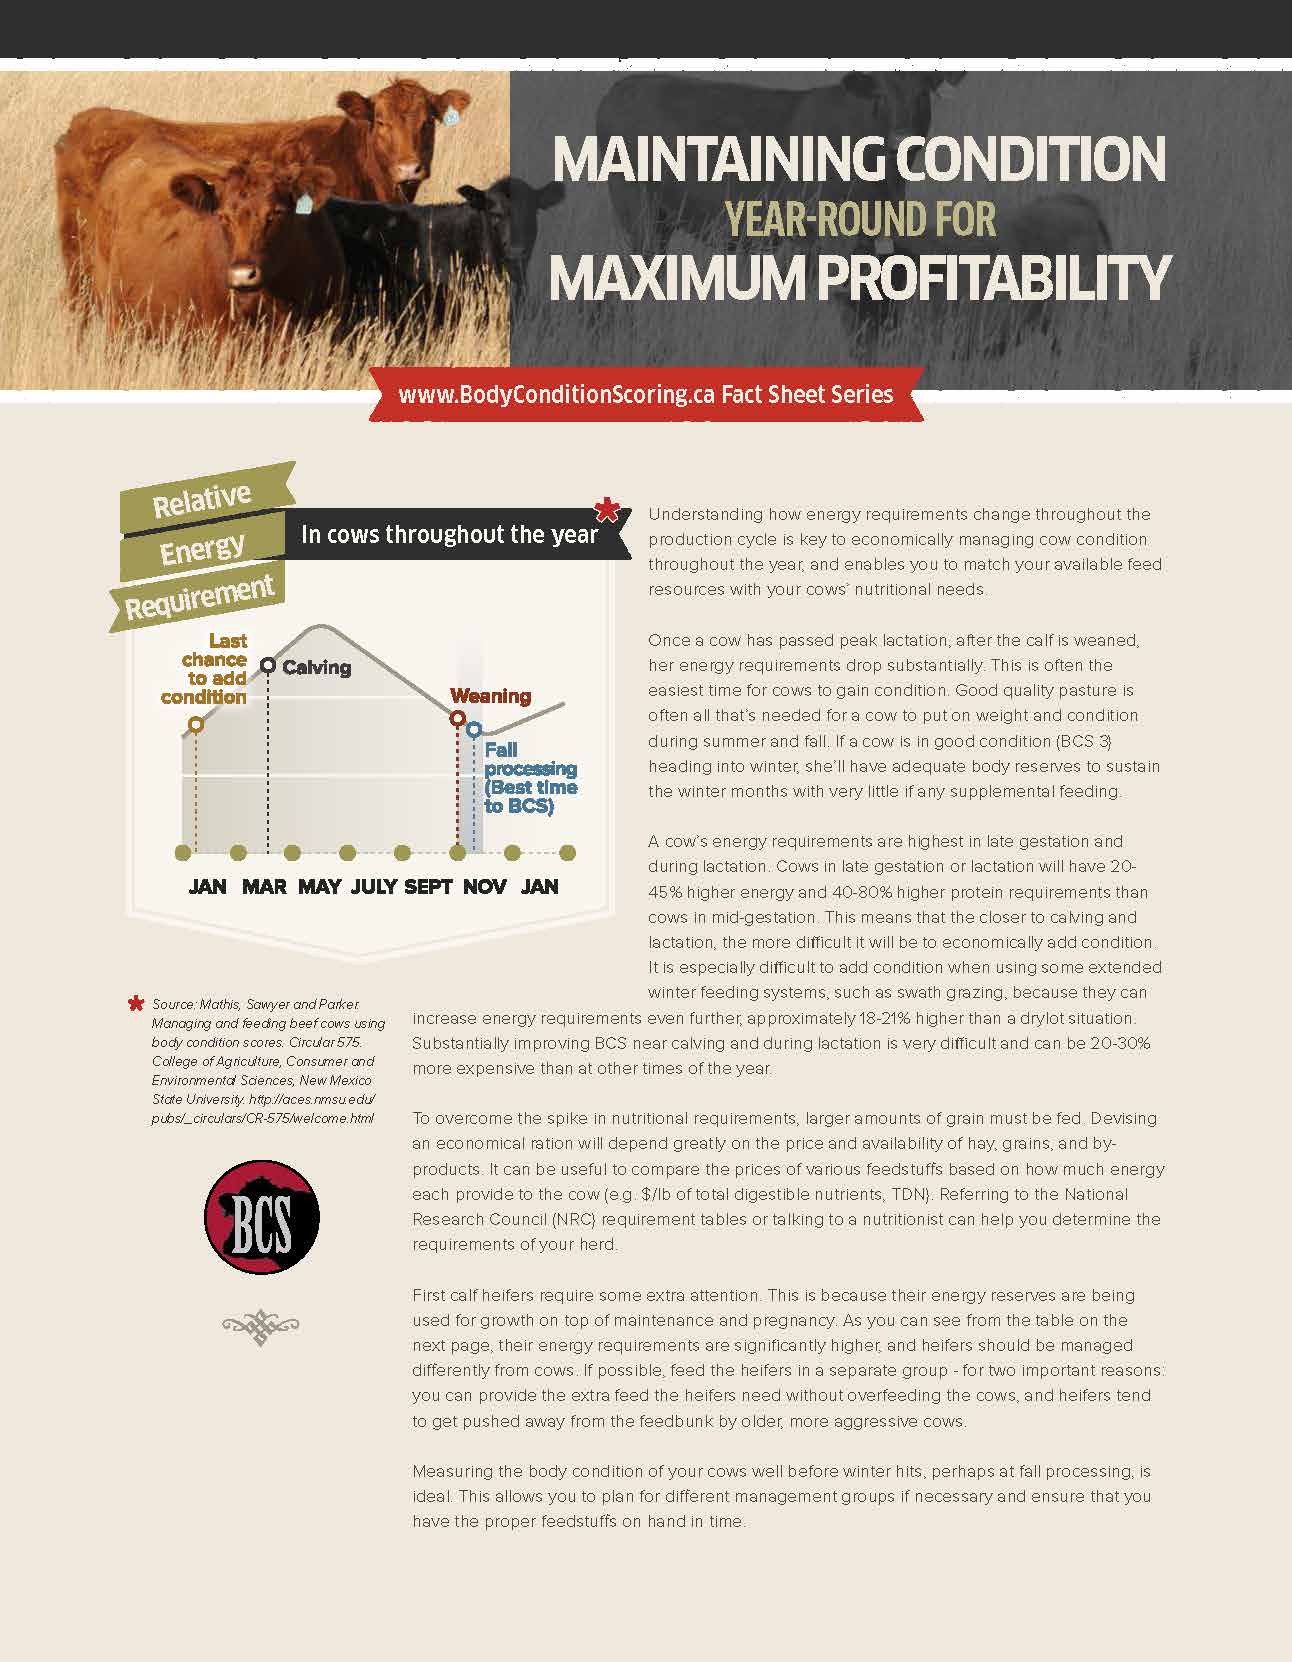
**Some types of extended grazing, such as swath grazing, can increase energy requirements by 18-21%.
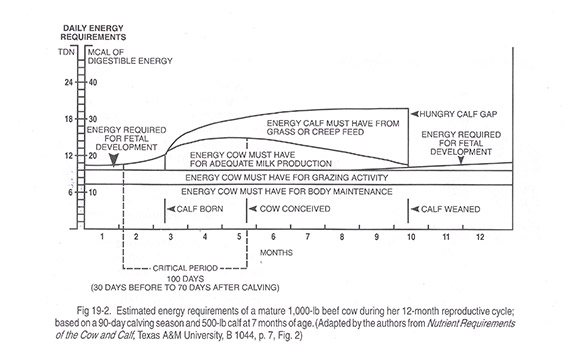
**Cows in late gestation or lactation will have 20-45% higher energy and 40-80% higher protein requirements than cows in mid-gestation.
When do I body condition score?
One of the best times to body condition score is during fall processing or pregnancy checking. This will give you time to add condition on thinner cows before winter sets in. Reproductive performance in the spring depends on nutritional planning in the fall.
The more often you body condition score throughout the year, the better youll be able to manage their nutrition to keep them at a score of 3.0 year-round.
What should I do if my animals are underconditioned?
If you have animals at a body condition score of 2.0 or lower, youll need to manage them differently than you have been in order to add body fat and bring them up to a 3.0.
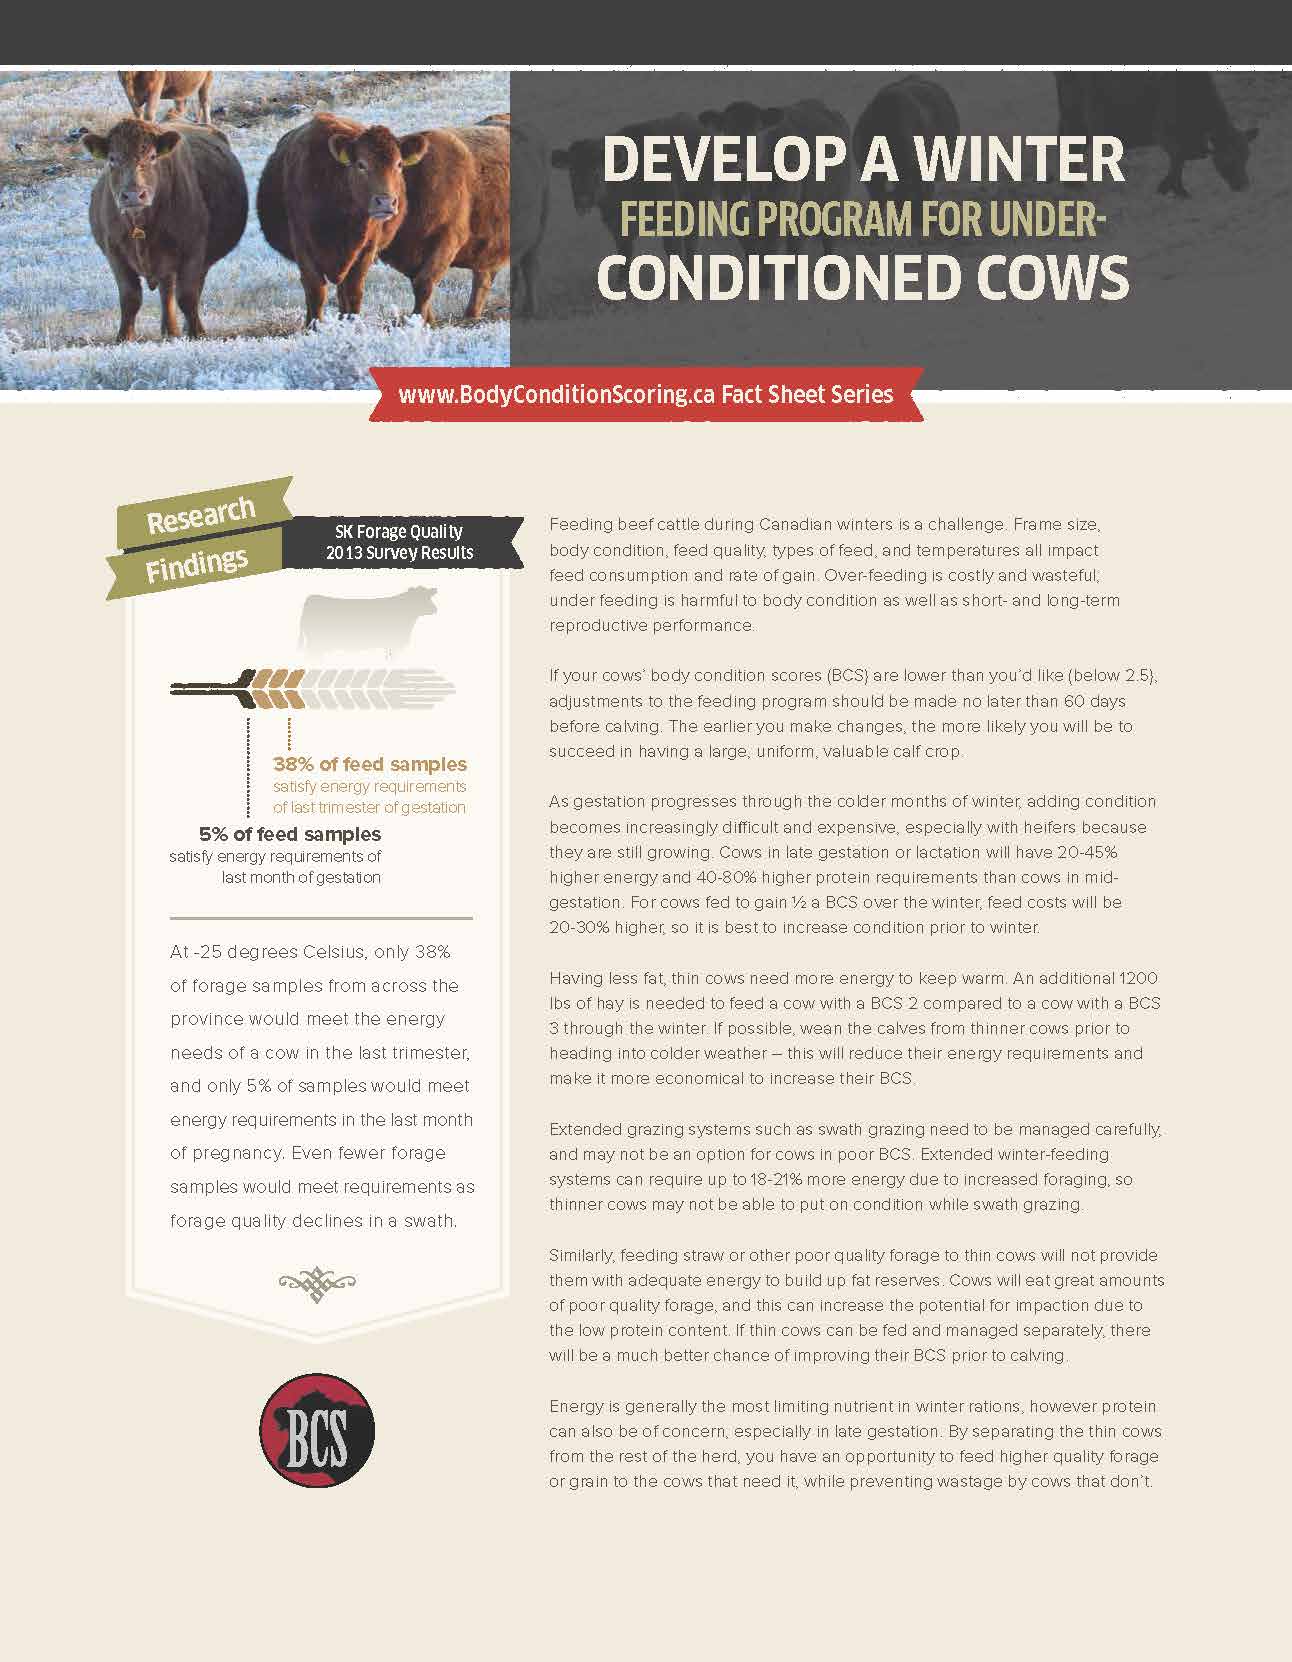 If cows are thin when they come home from pasture in the fall, work to improve their condition right away. Cow maintenance requirements increase substantially (up to 40% more) during the winter and during late gestation.
A 1400 lb cow will require about 200 lbs of body weight gain to move from a body condition score 2.0 to 3.0. To make this change in 90 days requires 20% more energy than a cow that is maintaining condition; to do it in 60 days requires 30% more energy. It will be 20-30% more expensive to try and increase condition during the winter.
When looking at a group of cows, if a small number of them are thin, that may mean that those few thin animals simply dont fit a given environment or management system. Larger numbers of thin cows within a group suggest the group doesnt have enough feed or that their feed is poor quality.
Feed testing is inexpensive and necessary to help ensure that your cows are getting enough nutrition. Judging your forages based on their plant type, colour, leaf content and knowledge of cutting time does not substitute for feed testing. Learn more about the value of feed testing and the nutritional needs of cows and heifers in each trimester at http://www.beefresearch.ca/blog/feed-testing/
 Cattle that are thinner or fatter than the rest of the group should be sorted out and managed separately. Your winter feeding groups might look something like this:
Group 1: Mature cows in good condition
Group 2: Bred Replacement Heifers/2nd Calvers
Group 3: Thin and Old Cows
Considerations
